Sunday, February 15, 2009

Number of Researchers by World Region and in EU-27, 2000 and 2006


The Figure above compares the number of researchers in major research-intensive world regions or countries. In 2006, there were 1.33 million researchers in EU-27, 1.39 million in the US and 1.22 million in China. Strong increases in the number of researchers have been observed from 2000 to 2006 in China (+9.9 % per annum) and South Korea (+10.8 % per annum), compared to EU-27 (+3.1 % per annum), Japan (+1.5 % per annum) and US (+1.5 % per annum). The number of researchers has grown on average twice as fast in the EU as in the US and Japan since 2000.
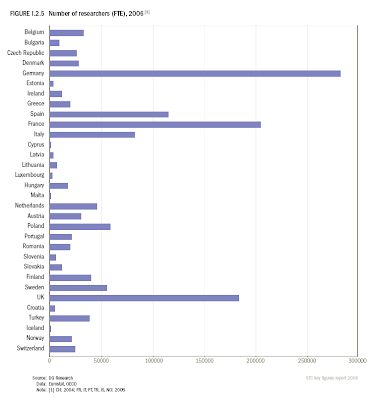

The Figure above compares the number of researchers in EU-27 Members. It illustrates that in EU-27, the three biggest countries – Germany (282,063), France (204,484) and the United Kingdom (183,534) – account for half of the researchers.


The Figure above shows the evolution of the total number of researchers and its per thousand labour force representation in EU-27. Within EU-27, the number of researchers has increased in all Member States over recent years. The strongest average annual growth rates have been observed in Malta, Cyprus, the Czech Republic and Denmark (more than 8 % per annum) .

The EU remains less researcher-intensive than the US and Japan. In 2006, the number of researchers per thousand labour force was 5.6 in EU-27, compared to 10.7 in Japan and 9.3 in the US. Within the ERA, the share of researchers in the labour force is highest in Finland (15.3 researchers per thousand labour force), Iceland (12.5), Sweden (11.7) and Luxembourg (11.4). The number of researchers per thousand labour force is lower than 5 in 11 EU Member States, as well as in Turkey and Croatia.

EU-27 experienced an increase in the number of researchers per thousand labour force, from 5 in 2000 to 5.6 in 2006, which corresponds to an average annual growth rate of 1.9 %. In comparison, the US and Japan have had average annual increases of 0.7 % (from 8.96 to 9.27) and 1.8 % (from 9.57 to 10.66) respectively over the same period. Many ERA countries had significant growth in the number of researchers per thousand labour force, in particular the Czech Republic, Denmark and Turkey.

Read more in:
Science, Technology and Competitiveness key figures report 2008/2009

Friday, February 13, 2009

EU R&D-Intensity 2006


The figure above shows the R&D Intensity in EU Member States. R&D Intensity is defined as the Gross domestic expenditure on R&D (GERD) as % of GDP.

Excerpt:
The stability of EU-27 R&D intensity at EU-27 level disguises quite different situations and developments across Member States. The EU-27 Member States and the Associated States are divided into four groups according to the level of R&D intensity:
  • a group of Member States with high R&D-intensities: Finland, Sweden, Denmark, Austria
    and Germany. Of the Associated States, Switzerland, Iceland and Israel have similar or higher R&D intensities;
  • a group of three Member States with medium-high R&D intensities close to the EU-27 average: France, Belgium and the United Kingdom;
  • a group of countries with medium-low R&D intensities (1 % to 1.7 %) composed of nine
    Member States and Norway;
  • a group of countries with low R&D intensities (less than 1 % of GDP) composed of twelve
    Member States, Turkey and Croatia.
Greece's R&D Intensity was 0.57 in 2006 when the EU-27 average was 1.84%; ranked 21st in EU-27. In 2004 Greece's R&D Intensity was 0.6% and EU-25 average was 1.8%; ranked 21st in EU-25. The target for 2010 is set to 1.5% (EU-25 estimate: 2.6%).

Read more in:
Science, Technology and Competitiveness key figures report 2008/2009

The Big Picture: EU15 vs. US Total Number of Publications and Citations in 1993-2002


The Figure above presents the research productivity and impact between EU15 and US in 1993-2002. It depicts the ratio of the publications and citations of the 15 European Union countries in EU15 to the United States on ISI databases in 1993–2002. (The EU15 total contains some duplication because of papers jointly authored between countries in the EU group. Counts for papers and citations are totals for country for the stated year.) Figure shows that the gap in the total number of publications and citations has shrunk significantly in that period. By 2002 the EU15 countries were publishing more papers than the United States and were not far behind on citations.

There are many potential flaws and concerns with this type of bibliometric analysis, such as the skewed impact of individual papers, the impact of self-citations , the aggregate of citations across disciplines and more. That explains why is difficult to find such analysis nowadays, but I think it worth posting since it provides the "Big Picture" or the forest in the "can't see the forest for the trees" expression. And if you believe that "the devil is in the details" I suggest reading the original article dated back in 2004!

The scientific impact of nations
Nature 430, 311-316 (15 July 2004)
David A. King