Showing posts with label eu-research. Show all posts

Tuesday, April 16, 2013

EU Innovation & Competitiveness 2011

EU Innovation and Competitiveness Report - 2011
This is one of the most comprehensive reports regarding EU's innovation and competitiveness (dated, June 2011). It's a 765 page report spanning several interesting topics. The report is divided into three main parts:
  • Part I: Investment and performance in R&D - Investing in the future
  • Part II: A European Research Area open to the world
  • Part III: Towards an innovative Europe - contributing to the Innovation Union
Here is the full report (~44MB).

Overall Picture

Since this is a huge report, my suggestion would be to first have a look to the overall picture. The following report shows how Europe is positioned in research and innovation in the world and provides insights about the new geography of knowledge.


Country Profiles 

If you are interested for a fact-sheet detailing  a specific country's profile, then follow the research and innovation performance by country page.

Greece

Here is the one about Greece's  research and innovation performance.

Enjoy!

Wednesday, October 14, 2009

Success rates of proposals in the FP7 program

Update:

As of June 2009 the report for the first TWO years (2007, 2008) is out:
FP7 Subscription and Performance During the First TWO Years of Implementation


What is the success rate of EU FP7 proposals?
What is the success rate of EU FP7 proposals in the COOPERATION program?
What is the success rate of EU FP7 proposals in the CAPACITIES program?
What is the success rate of EU FP7 proposals in the PEOPLE (Marie Curie) program?
What is the success rate of EU FP7 proposals in the IDEAS (ERC) program?
What is the success rate of EU FP7 proposals in the EURATOM program?
What is the success rate of EU FP7 proposals by Country?
What is the success rate of EU FP7 proposals by Groups of Countries (EU-27, Associated Countries, Candidate Countries, Third Countries)?

The figure above presents aggregated information on the above questions. Find all details for the first year of the program in the following EU report:
FP7 Subscription and Performance During the First Year of Implementation

Interested in FP6 performance? Read the following EU report:
FP6 Final review: Subscription, Implementation, Participation

Sunday, February 15, 2009

Number of Researchers by World Region and in EU-27, 2000 and 2006


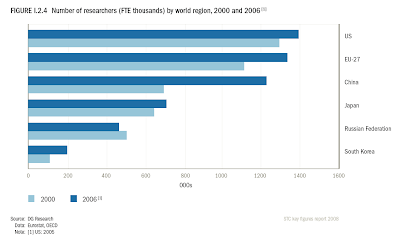
The Figure above compares the number of researchers in major research-intensive world regions or countries. In 2006, there were 1.33 million researchers in EU-27, 1.39 million in the US and 1.22 million in China. Strong increases in the number of researchers have been observed from 2000 to 2006 in China (+9.9 % per annum) and South Korea (+10.8 % per annum), compared to EU-27 (+3.1 % per annum), Japan (+1.5 % per annum) and US (+1.5 % per annum). The number of researchers has grown on average twice as fast in the EU as in the US and Japan since 2000.
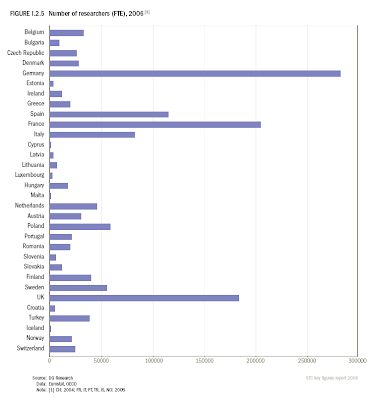

The Figure above compares the number of researchers in EU-27 Members. It illustrates that in EU-27, the three biggest countries – Germany (282,063), France (204,484) and the United Kingdom (183,534) – account for half of the researchers.
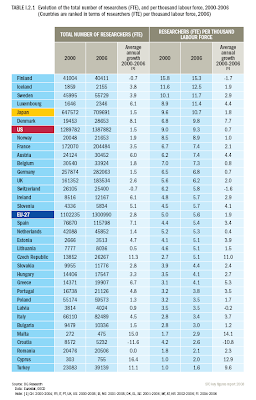

The Figure above shows the evolution of the total number of researchers and its per thousand labour force representation in EU-27. Within EU-27, the number of researchers has increased in all Member States over recent years. The strongest average annual growth rates have been observed in Malta, Cyprus, the Czech Republic and Denmark (more than 8 % per annum) .

The EU remains less researcher-intensive than the US and Japan. In 2006, the number of researchers per thousand labour force was 5.6 in EU-27, compared to 10.7 in Japan and 9.3 in the US. Within the ERA, the share of researchers in the labour force is highest in Finland (15.3 researchers per thousand labour force), Iceland (12.5), Sweden (11.7) and Luxembourg (11.4). The number of researchers per thousand labour force is lower than 5 in 11 EU Member States, as well as in Turkey and Croatia.

EU-27 experienced an increase in the number of researchers per thousand labour force, from 5 in 2000 to 5.6 in 2006, which corresponds to an average annual growth rate of 1.9 %. In comparison, the US and Japan have had average annual increases of 0.7 % (from 8.96 to 9.27) and 1.8 % (from 9.57 to 10.66) respectively over the same period. Many ERA countries had significant growth in the number of researchers per thousand labour force, in particular the Czech Republic, Denmark and Turkey.

Read more in:
Science, Technology and Competitiveness key figures report 2008/2009

Friday, February 13, 2009

EU R&D-Intensity 2006


The figure above shows the R&D Intensity in EU Member States. R&D Intensity is defined as the Gross domestic expenditure on R&D (GERD) as % of GDP.

Excerpt:
The stability of EU-27 R&D intensity at EU-27 level disguises quite different situations and developments across Member States. The EU-27 Member States and the Associated States are divided into four groups according to the level of R&D intensity:
  • a group of Member States with high R&D-intensities: Finland, Sweden, Denmark, Austria
    and Germany. Of the Associated States, Switzerland, Iceland and Israel have similar or higher R&D intensities;
  • a group of three Member States with medium-high R&D intensities close to the EU-27 average: France, Belgium and the United Kingdom;
  • a group of countries with medium-low R&D intensities (1 % to 1.7 %) composed of nine
    Member States and Norway;
  • a group of countries with low R&D intensities (less than 1 % of GDP) composed of twelve
    Member States, Turkey and Croatia.
Greece's R&D Intensity was 0.57 in 2006 when the EU-27 average was 1.84%; ranked 21st in EU-27. In 2004 Greece's R&D Intensity was 0.6% and EU-25 average was 1.8%; ranked 21st in EU-25. The target for 2010 is set to 1.5% (EU-25 estimate: 2.6%).

Read more in:
Science, Technology and Competitiveness key figures report 2008/2009

The Big Picture: EU15 vs. US Total Number of Publications and Citations in 1993-2002


The Figure above presents the research productivity and impact between EU15 and US in 1993-2002. It depicts the ratio of the publications and citations of the 15 European Union countries in EU15 to the United States on ISI databases in 1993–2002. (The EU15 total contains some duplication because of papers jointly authored between countries in the EU group. Counts for papers and citations are totals for country for the stated year.) Figure shows that the gap in the total number of publications and citations has shrunk significantly in that period. By 2002 the EU15 countries were publishing more papers than the United States and were not far behind on citations.

There are many potential flaws and concerns with this type of bibliometric analysis, such as the skewed impact of individual papers, the impact of self-citations , the aggregate of citations across disciplines and more. That explains why is difficult to find such analysis nowadays, but I think it worth posting since it provides the "Big Picture" or the forest in the "can't see the forest for the trees" expression. And if you believe that "the devil is in the details" I suggest reading the original article dated back in 2004!

The scientific impact of nations
Nature 430, 311-316 (15 July 2004)
David A. King

Wednesday, August 27, 2008

Remuneration of Researchers in EU25

The Figure above presents the average researchers’ remunerations in EU25 and Associated Countries. The averages are also presented in terms of standardized PPS, that considers the cost of living in each country, while allowing multilateral comparison at international level (including Australia, China, India, Japan and the United States).

The corrective coefficients in those countries are the PPP (Purchasing Power Parities) from 2003 published by the World Bank.

The accuracy of the data (consistency and reliability of the study results) are either excellent or high in 20 out of the 33 countries analyzed in this study, representing 87,15% of the total number of researchers in Europe.

A number of results from this study can be discerned:
  • High differences between the remuneration of researchers throughout the EU25 and Associated Countries, although the gap between the levels of remuneration in each country reduces when considering the cost-of-living.
  • Only Austria, The Netherlands, Israel, Switzerland and Luxembourg have an average remuneration similar to that of the United States, considering the cost of living in each country.
  • High differences in expected career progression throughout the EU25 and Associated Countries.
  • In most of the countries, the remuneration for men is higher than for women.
In Greece, the average researcher's salary is 25.685 Euro much below the EU25 average of 37.948 Euro. If we normalize in terms of standardized PPS, that considers the cost of living in each country, the numbers are 30.835 Euro and 40.126 Euro respectively.

Read more here (dated: Apr 2007)

Saturday, August 9, 2008

The quality of Europe's scientific publications

The Figure on the side presents recent data on the 'Field-normalised Citation Impact Score' per scientific discipline for both the EU-25 and the US. It shows that the EU-25's scientific impact is around or below world average in almost all scientific disciplines. The EU-25 demonstrates a citation impact score above world average in 6 out of the 37 sub-fields, namely in 'Information and Communication Sciences', 'Physics', 'Astronomy', 'Civil Engineering', 'Earth Sciences' and 'Chemistry'.

Excerpt:
One of the most widely used proxies to assess the impact of scientific work are citations. Citations to scientific articles provide an indication of the extent to which the scientific work of a research unit/university/country has influence and impact on the world scientific community. The more citations a scientific oeuvre gets, the bigger its impact and relevance.

In this figure, the so-called 'Field-normalised Citation Impact Score' per scientific discipline is used as impact indicator. This indicator is considered as one of the most suitable measures for international comparisons. It is the ratio of the actual number of citations received per publication (excluding self-citations) published in a scientific sub-field to the ‘expected’ (average) number of citations received by all papers published worldwide in the same sub-field.

If the ratio is above 1.0, this means that the scientific oeuvre is cited more frequently than the world average. The denominator (average number of citations per sub-field) is a weighted average taking into account differences in impact between the journals related to the sub-field in question (thus high-impact journals are more heavily weighed than low-impact journals).

Compared to the US, the EU-25 demonstrates lower impact scores in 35 out of the 37 scientific disciplines [in two sub-fields of the Social Sciences the EU-25 shows a higher ('Information and Communication Sciences') or similar ('Social Geography and Demography') score]. The gap with the US is particularly striking (i.e. difference in citation impact >0.5) in disciplines such as ‘Chemistry’, ‘Computer Sciences’, ‘Material Sciences’ (in terms of number of publications the most important sub-field of the 'Engineering Sciences'), ‘Economics’, and ‘Statistical Probability and Analysis’.

Read more here (dated: 4 Apr 2007)

Friday, August 8, 2008

EU R&D funding - Public vs. private


The figure on the side shows the public versus private funding of R&D (GERD funded by government and by industry, as % of GDP), 2005.

Excerpt:
R&D efforts are largely financed by the business enterprise sector in Europe, the US and Japan. However, the role of government in the financing of R&D should not be underestimated. The level of government-funded R&D intensity is substantial in many high R&D intensive countries (e.g. Nordic countries, Germany, France, Austria and the US), showing that high private involvement in the funding of R&D does not preclude government funding. Moreover, in low R&D intensive countries, government-funded R&D is higher than business funded R&D. Government funding of R&D is critical for creating and developing S&T capabilities -a prerequisite for catching-up with countries at the technology frontier, or for supporting research projects with high expected social benefits (see Figure 3.8).

In the EU-25, government funding of R&D has been very stable since the end of the 1990s at around 0.64% of GDP (last year available: 2005). In the US, government-funded R&D shows more variability: it decreased from 0.8 to 0.7% of GDP between 1998 and 2001 and rose again from 0.71% of GDP in 2001 to 0.83% in 2004.

Read more here (dated: 4 Apr 2007)

Gap in R&D expenditure EU-27, US, Asia


The figure on the side shows the Gap in R&D expenditure (GERD) between EU-27 and US, and EU-27 and 5 Asian economies - in constant terms (million PPS, at 2002 prices) - 1995-2004

Excerpt:
Between 2000 and 2004, the gap in real terms in total R&D spending between Europe and the US was not reduced, and in fact increased slightly. After 2000, a new R&D gap emerged between Europe and a small group of important Asian economies including China, Taiwan, Japan, Singapore and South Korea.


Read more here (dated: 4 Apr 2007)

R&D Intensity Comparison (EU-US-JP-CN)

The figure on the side shows the R&D Intensity in EU-25, US, Japan and China (1995-2005).

Excerpt:
After a period of slow but continued growth between 1996 and 2002, the EU-25 R&D intensity has been slightly decreasing between 2002 (1.89%) and 2005 (1.85%) (see Figure 3.1). Since in the US, the downward trend has come to an end, the gap in R&D intensity between the EU and the US is increasing again since 2002. The R&D intensity in Japan has been growing faster than in both the EU and the US over recent years. If the current trend persists, China will have caught up with the EU-25 by 2009 in terms of share of GDP devoted to R&D.

An examination of the individual Member States’ pace of progress after 2000, reveals a distinction between four groups of EU countries. A first group including the R&D-intensive countries Finland, Denmark, Austria and Germany, have been able to further increase their high R&D intensity and are pulling further ahead. Especially Austria has been able to progress very substantially over the recent years. France and Sweden experienced in the subsequent years a weakening of their growth performance and are now losing momentum. The new Member States Slovakia, Slovenia, Poland and Bulgaria, as well as Greece, and to a lesser extent Luxembourg, the UK, Belgium and the Netherlands are falling further behind since 2000. Conversely, most of the other new Member States, in particular Malta, Cyprus and Estonia, and to a lesser extent Spain, Ireland, Italy and Portugal, have been catching up with the EU average. At the same time, development gaps in terms of the production of scientific knowledge and technological innovation between EU regions, even between regions in leading Member States, remain substantial (see Eurostat data on R&D expenditure and personnel in the European regions). The European research landscape remains characterized by a high concentration of research effort in comparatively few Member States and, within them, in comparatively few regions.

Read more here (dated: 4 Apr 2007)

Wednesday, July 30, 2008

EU R&D Intensity

The figure on the side shows the R&D Intensity in EU Member States. R&D Intensity is defined as the Gross domestic expenditure on R&D (GERD) as % of GDP.

Excerpt:
Through the revision of the Lisbon strategy in 2005, further strengthening of R&D policy as part of a reform agenda geared towards more growth and jobs. Following that, all Member States have in their National Reform Programmes now established targets for R&D expenditure, tailored to their specific situations (see Figure), which, if they were met, would in 2010 lead to an EU R&D intensity of 2.6% gross domestic product.

Greece's R&D Intensity was at 0.6% at 2004 (EU-25 average: 1.8%) and ranked 21st in EU-25. The target for 2010 is set to 1.5% (EU-25 estimate: 2.6%). Notably, Sweden and Finland were at 3.8% and 3.4% respectively with 2010 targets of 4%.

Read more here (dated: 4 Apr 2007)